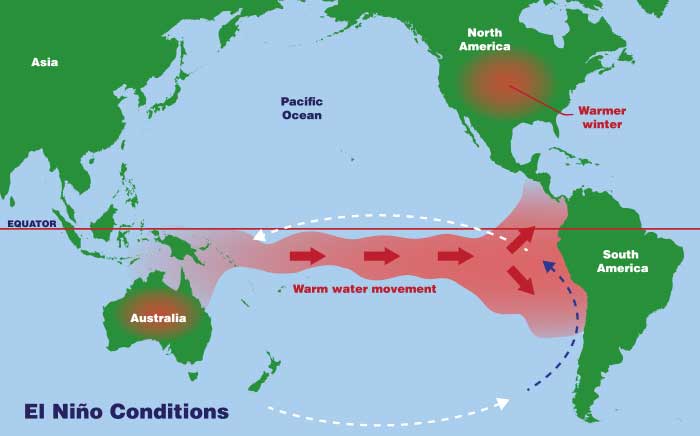
This year in central Arizona we’ve experienced the wettest May on record and the first recorded rainfall in Phoenix ever on the date of June 5. This is all probably due at least in part to the El Niño effect.
During an El Niño the surface water in the Pacific ocean off the coast of Peru and Ecuador becomes warmer than usual (currently about 4 degrees F above normal). This has effects on the weather all over the world.
The El Niño effect can be seen as an oscillation of warmth back and forth across the Pacific. Years when the water off Peru is colder than normal have been dubbed La Niña years, and the effects on weather are basically the opposite.

The largest effect is on South America, where the warmer water evaporates more and causes a lot more rainfall, but weather over much of the world is also affected.

Computer models predict that this year’s El Niño could be the strongest in many years, and could have a big effect on weather if it continues to build into the fall and winter as predicted. Among the predictions:
– It could take a big bite out of the drought in California and Arizona — a strong El Niño is associated with up to a 174% increase in precipitation in California;
– Fewer hurricanes in the Atlantic than usual;
– Fewer tornadoes than usual in the mid-west;
– A milder than normal winter for much of the US.
– On the flip side, they predict an “extremely active Pacific typhoon season”. There are some cool graphs and maps at the link at the top of this paragraph.
Most of this sounds good for us! The biggest worry is that the increased rainfall in California and the southwest could cause flooding damage and injuries. And then there’s this:
El Niño has an interesting effect on overall global temperatures. See the graphs below.
The top graph shows global temperatures. The bottom graph shows sea temperature deviations in the eastern Pacific; red is warmer than average and blue is cooler than average.

Note how global temperatures tend to rise during an El Niño, and dip during La Niña. Note the spikes in the lower graph, particularly in 1973, 1983 and 1998. In each case the global temperatures hit a new high, and then plunged for several years afterwards. The strongest El Niño event in recent history occurred in 1998, and is associated with the highest average global temperatures ever recorded. The El Niños since then have been milder, and the La Niñas unabated, causing some observers to speculate that the rise in global temperatures has stopped. But in the long view, 1998 is clearly an outlier event caused by that year’s El Niño, with the general trend unaffected. If this year’s El Niño turns out to be as strong as predicted, we should set new records.

4 responses so far ↓
1 Dale // Jun 9, 2015 at 4:56 pm
This might not be the best year for me to travel the West Coast!
2 Donna // Jun 9, 2015 at 5:37 pm
Weather is really interesting, isn’t it? Thanks for the lesson.
3 Daryl // Jun 9, 2015 at 10:03 pm
Dale, Winter is when it’s supposed to get really wet. There might be a little more rain in the summer, but flooding will probably wait until winter.
So it’s probably an OK summer to travel the west coast.
4 Don // Jun 11, 2015 at 6:14 pm
I remember one day during the 98 El Nino that I couldn’t see my backyard fence from the back door due to the rain. This was in our previous residence where the fence was slightly further from the door than this house but not much.
On March 20th, 2011 we got 5″ of rain in one day. That was amazing.
We really need the rain here and I guess Arizona is in about the same boat. Hopefully this El Nino will solve the drought problem without creating too many new ones.
Leave a Comment