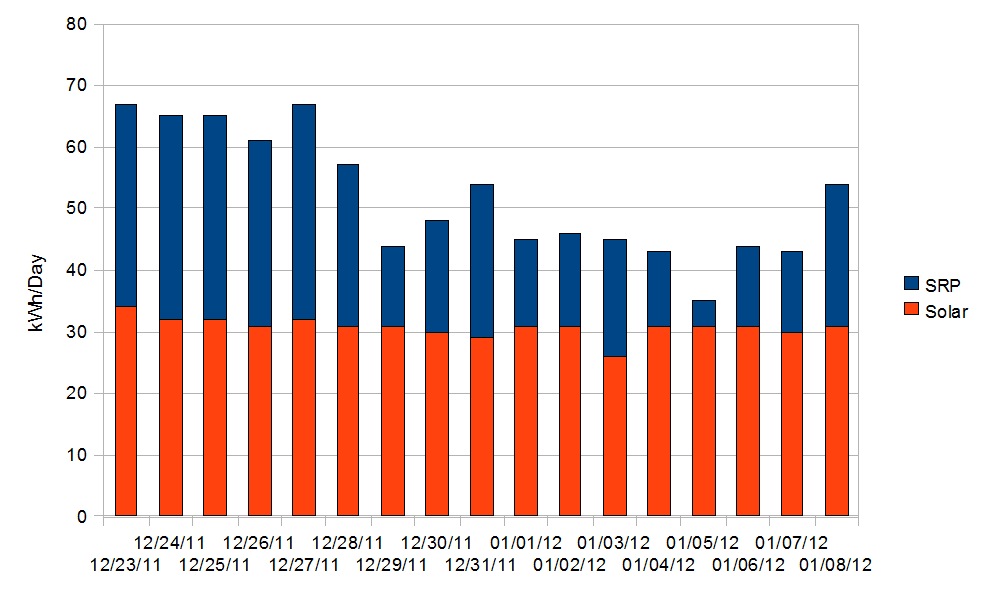
Here’s a graph showing the energy I’ve used since installing the solar panels two and a half weeks ago. The blue is energy I have bought from SRP, and the red is energy the solar panels have generated.
You can roughly infer the weather from looking at the graph. The sky has been clear except for some high thin clouds on January 3rd. The solar energy is down a little that day. And the total energy used each day has fallen as the temperature has gone up, until yesterday when it was cooler.
Cumulatively, I’ve bought 412 kWh from SRP, and generated 580, or about 61% of my total consumed energy. There are cooler days forecast, so that ratio is probably going to come down.


5 responses so far ↓
1 Dale // Jan 9, 2012 at 2:06 pm
Do you make these graphs or are they generated by the system? The colors ate really nice!
2 Daryl // Jan 9, 2012 at 2:15 pm
I have made all these graphs myself with a spreadsheet. I will have a data logger installed in a week or so, but for now I am out at the meters several times a day manually collecting data.
Glad you like the colors!
3 Richard // Jan 9, 2012 at 4:01 pm
Impressive! I just put my solar panels up so we’ll see how we do. I hope to generate 100% of my power needs, but may need to run the generator some if we get cloudy days, or if the household refrigerator uses more power than I can generate.
4 Daryl // Jan 9, 2012 at 4:16 pm
It’s supposed to be partly cloudy the next few days. My production was down to 28 today (so far), vs. the usual 31, so still not too bad.
I’m still getting about 800 watts at 4:10pm, but it’s dropping fast. I doubt I’ll bump the meter up any more today.
5 Daryl // Jan 12, 2012 at 8:12 pm
Cloudy day today. I only made 17 kWh, compared to the usual 30. And since it was cooler, I used more energy to heat the house, so solar only provided about 1/3 of my energy.