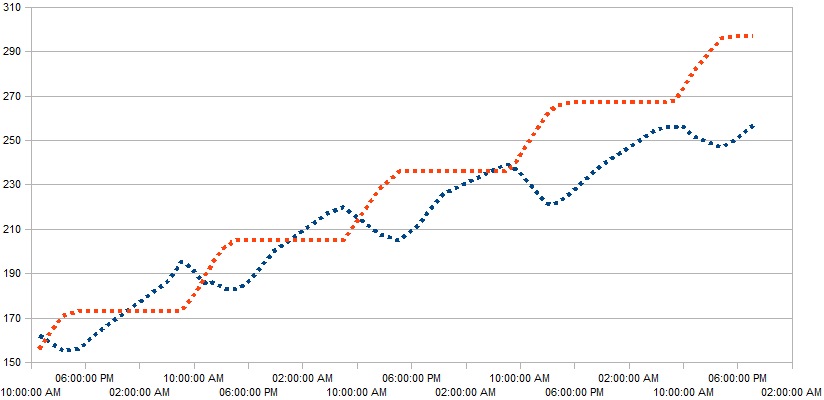
Here’s a graph showing the the progress of our two power meters over about 4 days. The red line is from the meter that measures the solar power we generate. The blue line is the SRP meter. The vertical axis is in kWh.
Notice the solar meter does a “stair step”, rising during the day, then completely level at night. The SRP meter, on the other hand, rises all night while we heat and light our home, then falls each day while we feed power back to SRP.
The solar meter is rising a little faster overall than the SRP meter, indicating that our solar panels are providing a little more than half of our total energy.

I estimate that in March, April and May we should generate more energy each month than we use. The days are longer, so there is more sunlight to harvest, but it won’t be hot enough yet to use much cooling. My electric bill for those months should be zero, except for the monthly service charge of $15. We’ll see — I’ll certainly report on it.
